

For 45 weeks, bitcoin kept running into the same line on the chart and getting turned back. On the week ended Sept. 20, it finally closed above it.
That line is the 50-week moving average. Alex Thorn, head of Galaxy Research, described the weekly close above it as a potentially important confirmation that the market’s bear phase may have run its course and that a new uptrend is upon us. That’s a bold call. Galaxy’s own historical data backs it up, with some caveats.
Galaxy’s count is 11 of 13
Galaxy looked at bitcoin’s major slumps going back to 2011. In that stretch, bitcoin closed a week back above its 50-week moving average 13 times.

In 11 of those cases, the market didn’t go on to set a new low. The worst of the decline had already passed by the time the crossover showed up.
Galaxy has described the average as a kind of ceiling during major bitcoin drawdowns. Once the price drops below it, attempts to take it back have historically failed until the market is closer to a durable low. And when a breakout did stick, it marked the end of a bear market and cleared the way for a strong bull run.
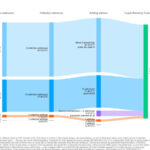
Some of the crossovers that came before those runs are shown above. Read the multiples with some caution. They’re approximate because early BTC price data is inconsistent, so they show how large the rallies that followed were. They don’t prove the moving-average crossover caused them.
The two times it didn’t work
Past performance doesn’t guarantee future results, and the signal has missed before.
Both failures happened in the volatile stretch from late 2021 into early 2022. Bitcoin moved briefly above the average, rolled over and eventually fell toward $16,000. Galaxy identifies those failed reclaims as the Dec. 26, 2021, and March 27, 2022, crossovers.
That’s the part worth keeping in mind. A signal that works 11 of 13 times is useful, but it’s still just a signal. The most recent failures were in the last cycle, and those are the ones traders remember best.
Why the weekly close matters
Bitcoin trades around the clock, but its weekly candle closes at 23:59 UTC on Sunday, and a new one opens immediately afterward. A candlestick is the chart’s representation of one period’s price action, in this case a full week.
This time the weekly candle closed above the 50-week average. It didn’t just poke through it. Analysts typically put more weight on a weekly or daily close above a major moving average than on a quick move through it, because a close filters out intraday noise.
The 50-week moving average itself is simple. It’s the average weekly closing price over roughly the past year, and analysts often use it as a proxy for bitcoin’s long-term trend. When bitcoin is advancing in a healthy way, it tends to trade above the line. During long declines, rallies often fail below it.
Where the price stands now
Bitcoin rose nearly 6% during the week and traded around $81,000, stretching its rebound to 29% over the past 35 days. At the time of writing, it was near $81,450, while the 50-week average sat at $78,115. The ticker has since shown BTC at $84,327.90.
If history holds, the reclaim suggests the bear-market low may have been set near $60,000 in recent months. It also raises the possibility that bitcoin could keep climbing toward new highs.
The cushion is thin, though. About $3,300 separates the price from the line, and the signal only means something if bitcoin holds above that average in the coming weeks. Keep an eye on the Sunday close at 23:59 UTC. If a weekly candle finishes back below $78,115 or so, you’re looking at the 2021 script, not the 11 wins.