Bitcoin is up on Friday. Traders don’t seem to believe it’ll last.
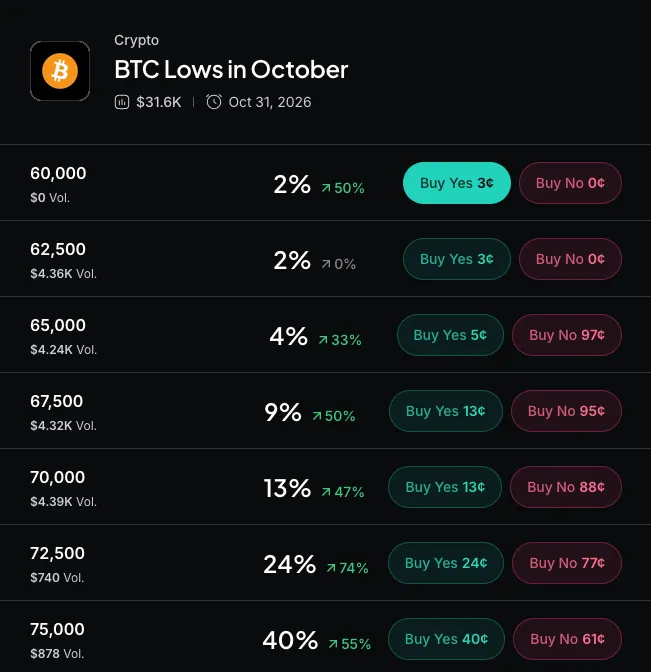
Bitcoin trades around $82,837, up 1.38% on the day. That comes after Thursday’s drop to $80,427, its lowest level since early September. Prediction market bettors put a 67% chance on Bitcoin trading at or below $80,000 at some point in October.
Prediction markets aren’t buying the bounce
Myriad, a prediction market owned by Dastan, has traders pricing in more downside. Beyond the 67% odds on $80,000, its markets give 40% odds that Bitcoin touches $77,500 this month and 24% that it reaches $75,000.
A separate weekly market puts 49% odds on Bitcoin finishing the week above $87,500. Taken together, those bets point to a month of price compression with some room for further downside. Traders aren’t calling for a crash. They’re also not calling for a breakout.
The bounce doesn’t erase last week
Total crypto market capitalization rose 2.1% to $2.89 trillion on Friday. That’s a partial repair job. A week ago the market sat above $3 trillion, and Bitcoin was pressing against its yearly high.
Sentiment has cooled with it. The Fear & Greed Index fell to 56, a neutral reading. On October 2 it was at 71, firmly in “greed” territory.
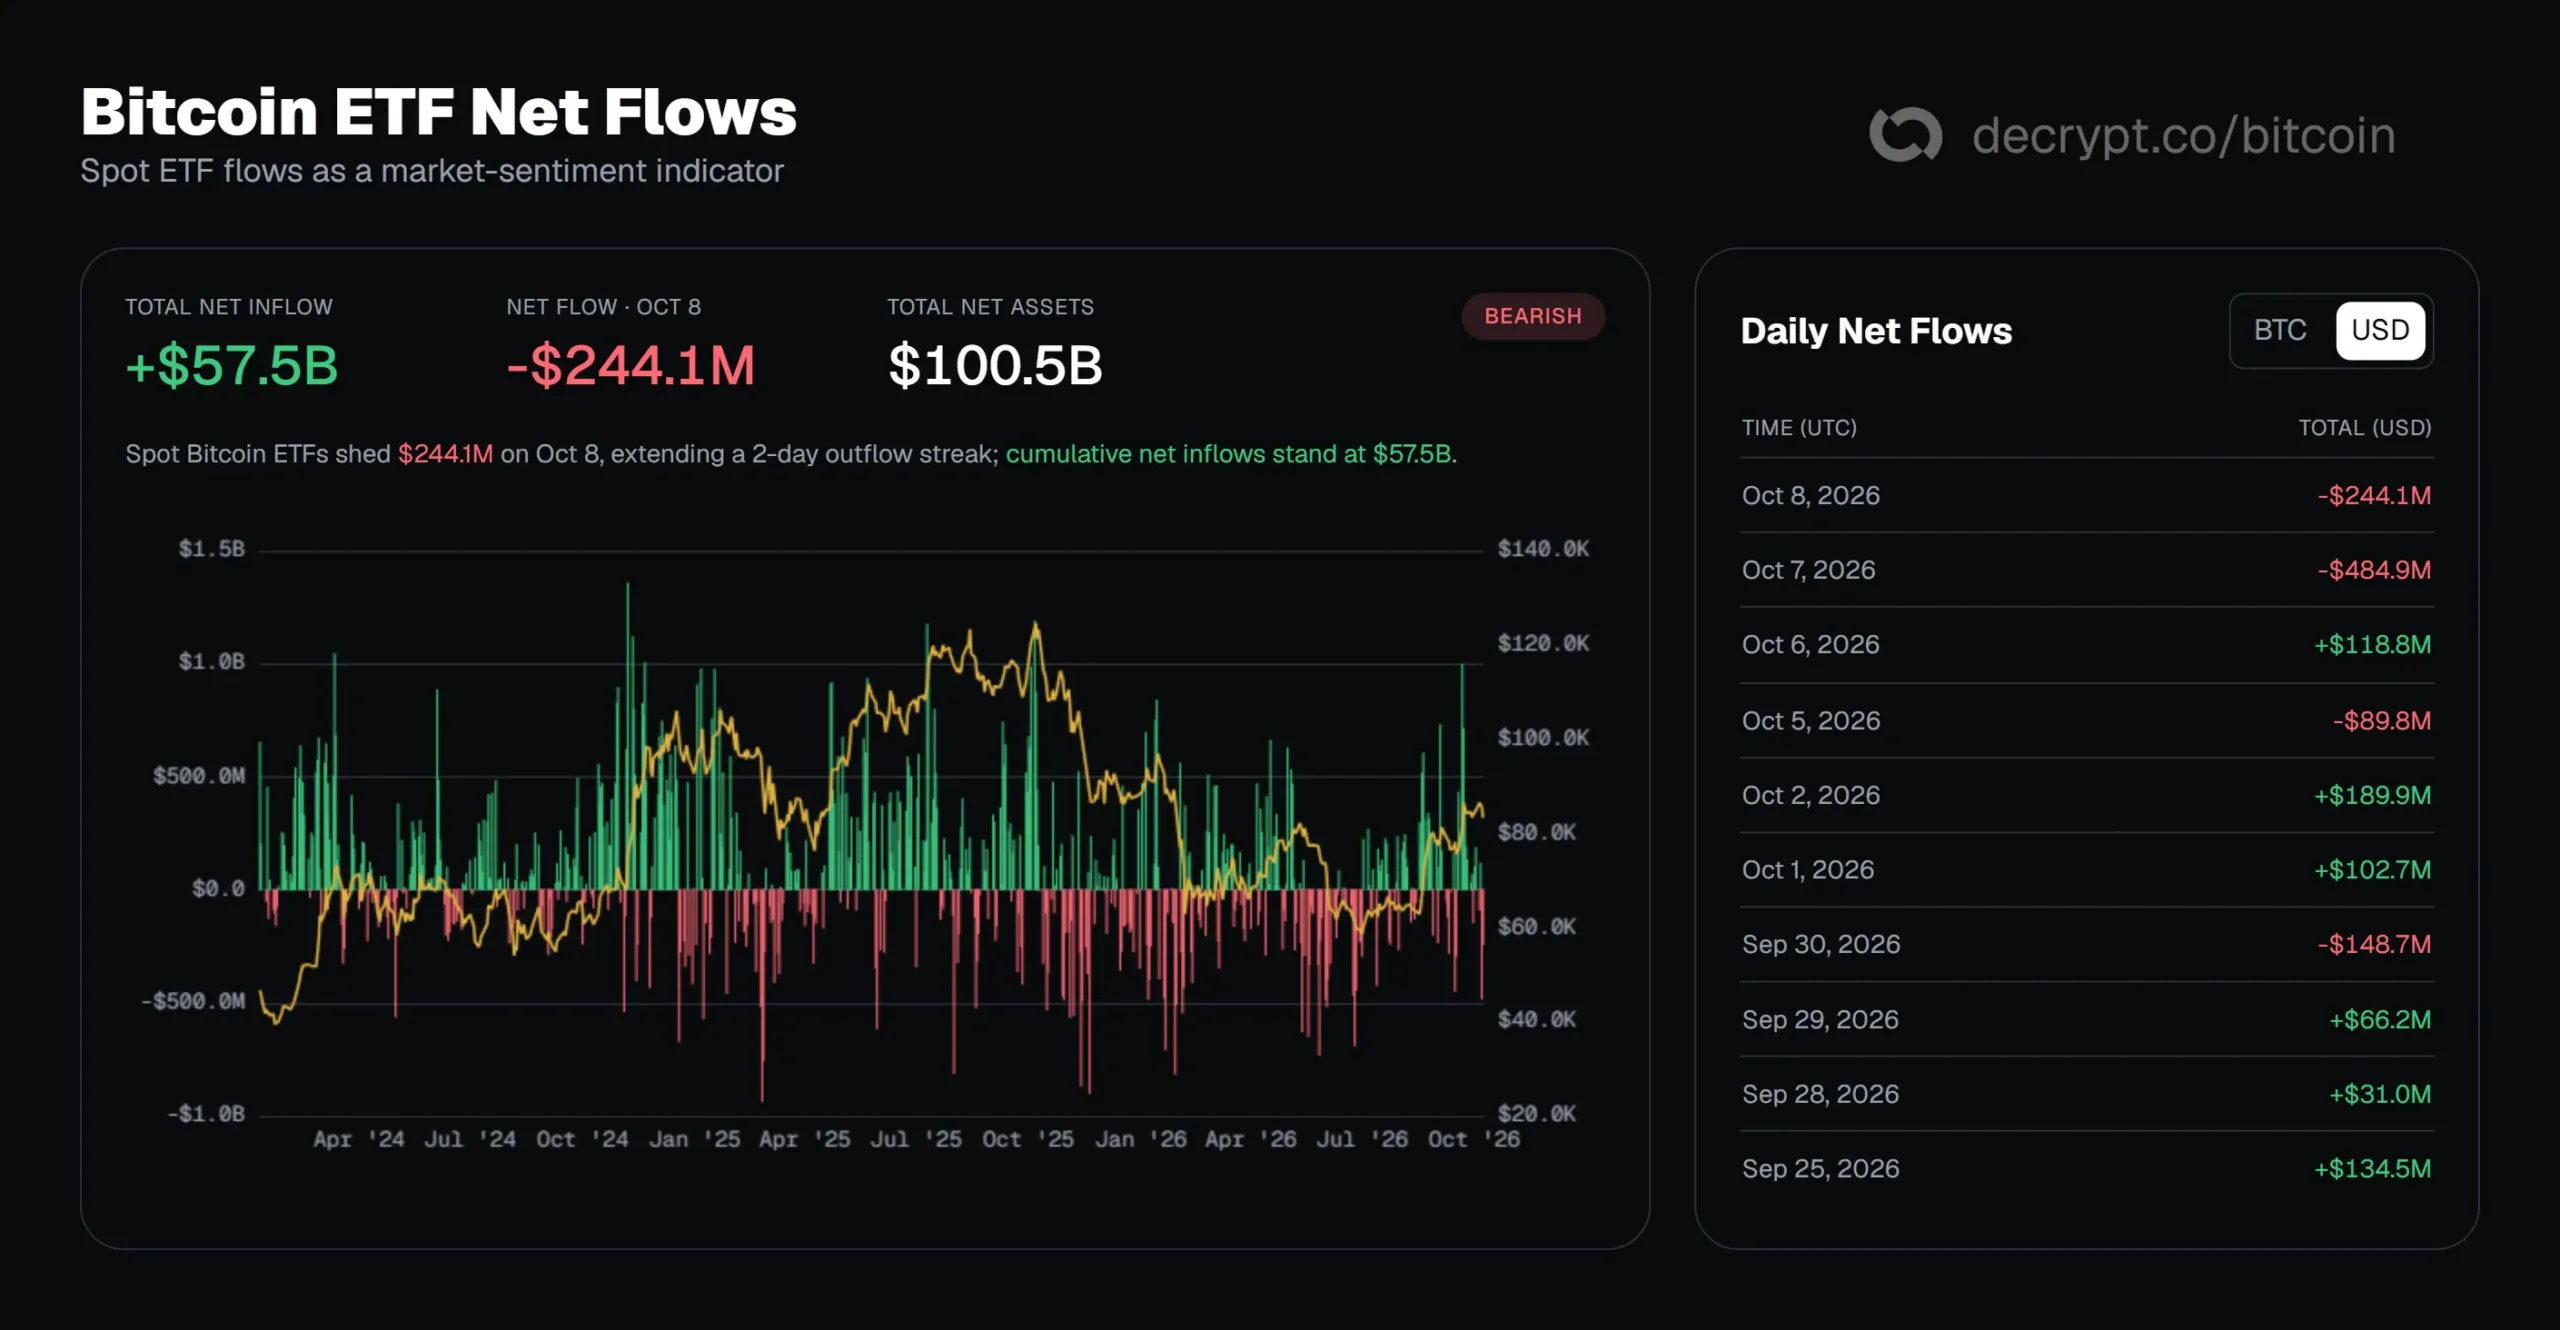
And Wall Street is pulling money. Bitcoin ETFs shed $484.9 million on Wednesday, their worst day since June 25. Another $244 million left on Thursday.
The trend is weaker but still points up
Friday’s daily candle opened at $81,711 and has moved between $81,553 and $83,443. On the four-hour chart, price is still below the 50-period exponential moving average. So the short-term trend hasn’t turned yet.
The daily chart reads differently. The Average Directional Index, or ADX, measures trend strength regardless of direction, and it sits at 37.9. That’s well above the 25 level that confirms a real trend. Buyers (DI+) remain above sellers (DI-) on the directional lines, which means the trend is still bullish even after the pullback.
The Relative Strength Index, or RSI, measures buying pressure on a scale of 0 to 100. It reads 51.2, neutral, matching the Fear & Greed Index. That fits a picture of Bitcoin cooling off after an overbought phase, not breaking down.
Watch $83,000 first
Luke Deans of Bitwise Europe said the $83,000 zone combines the average ETF cost basis with the prior higher-high level. That makes it the first test for this bounce.
If Bitcoin reclaims it, the $84,433 zone comes into play. Above that, the September high at $87,354.33 is the ceiling bulls need a daily close above.
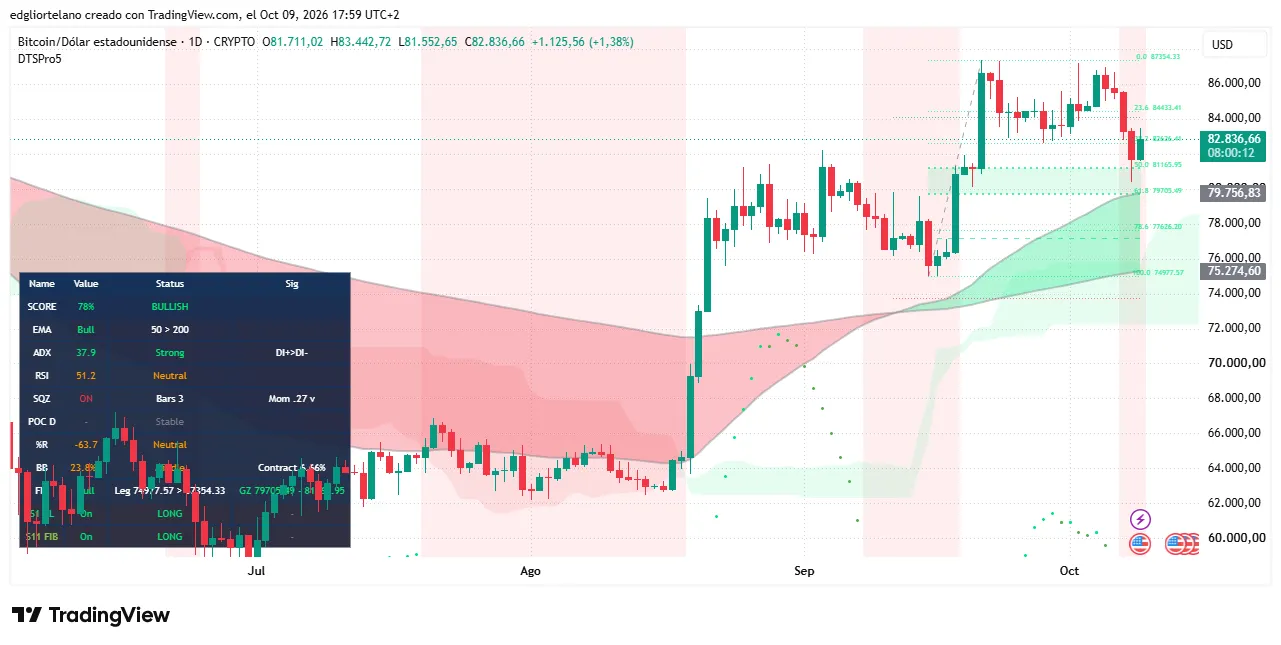
Friday’s high so far is $83,443. That’s barely past the first line Deans flagged, and the four-hour chart hasn’t confirmed anything yet. If you’re watching, wait for a daily close above $83,000 before you call this a recovery.