

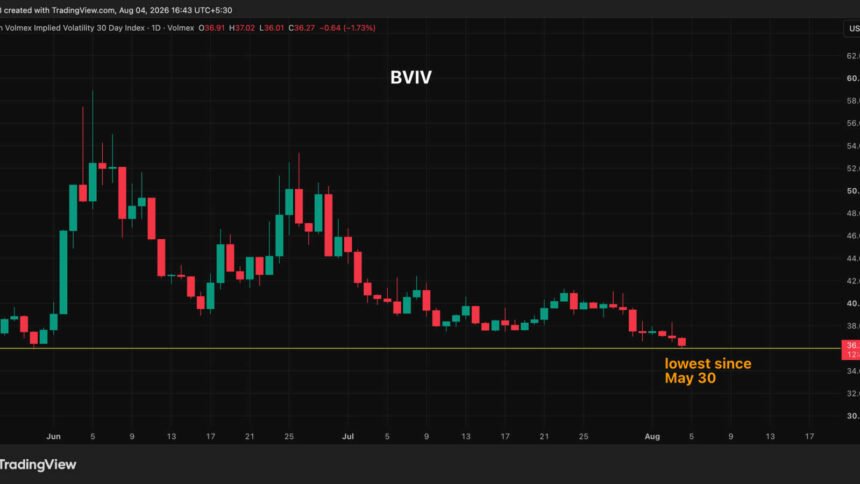
Bitcoin’s 30-day implied volatility index sits at 36%, the lowest reading since May 31. In early June it was near 60%. That collapse is happening in the same week the market absorbed a multimillion-dollar Coldcard hack, watched institutional money walk out the door, and got no clarity at all on regulation or the macro picture.
Any one of those would normally show up in the options market. Traders buy protection when they’re scared. They aren’t buying.
What the BVIV is actually measuring
The index tracks demand for options and hedging bets, the kind of positioning traders reach for when they expect uncertainty and violent swings. A falling BVIV means nobody’s paying up for insurance.

There’s an old read on this: a market that doesn’t freak out on bad news is bullish, primed for a notable upswing. It’s a tidy story. It’s also incomplete.
Cheap volatility doesn’t stay cheap
Volatility is mean-reverting. It rises after dropping below historical standards and falls when it gets overvalued. The BVIV is now hovering at levels that have previously served as a floor, which sets up the conditions for a volatility boom.
So watch the gauge rather than cheer it. Any surge tends to arrive alongside a big directional move, and the direction isn’t promised to be up.
The flow data leans bearish
Institutional demand is anemic. U.S.-listed spot bitcoin ETFs posted $61.53 million in outflows last week, ending a three-week run of tepid inflows. Tepid, and now negative.
Stablecoins tell the same story from a different angle. USDT’s market cap, the largest among dollar-pegged stablecoins, has fallen to its lowest level since October. USDC’s is also in a downtrend.
Roughly $14 billion has drained out of the two biggest stablecoins
USDT’s market cap has declined to $183 billion from nearly $190 billion in April. USDC has dropped to $72 billion from $79.5 billion in March.
In a broader crypto bear market, that slide is a classic confirmatory signal of weak demand-side pressure. Less capital sitting ready to buy. Tighter liquidity. Risk appetite that hasn’t come back.
The competition for your money got better
Real, inflation-adjusted returns on longer-duration Treasury notes have risen to the highest since 2008. When the risk-free side of the ledger pays that well, emerging technologies and risk assets have to work harder to justify themselves.
And the U.S. Clarity Act’s passage remains uncertain, which leaves the regulatory question exactly where it’s been.
One number argues the floor is real
The counterweight is on-chain, and it’s specific.
“Approximately 155,000 BTC moved into the $62,000-$65,000 cost-basis range, indicating that selling was absorbed by buyers near current prices. This concentration now represents 0.7 percent of circulating supply and could keep BTC range-bound until a stronger catalyst emerges,” analysts at Bitfinex said.
That’s the mechanism behind the calm. Sellers have had a bid to hit at these levels, so the price hasn’t had to hunt for one lower down.
Meanwhile, the exchanges keep building
Binance remains crypto’s leading exchange, expanding from spot and derivatives into RWAs, payments, savings, yield, and broader financial services.
What to watch
Treat 36% as a coiled spring, not a green light. The 155,000 BTC parked between $62,000 and $65,000 is what’s holding this range together, and it’s 0.7 percent of circulating supply doing the work. If that band gives way, the volatility index won’t be at 36% for long.
Stay alert.