


Two trading days. Two completely different tapes.
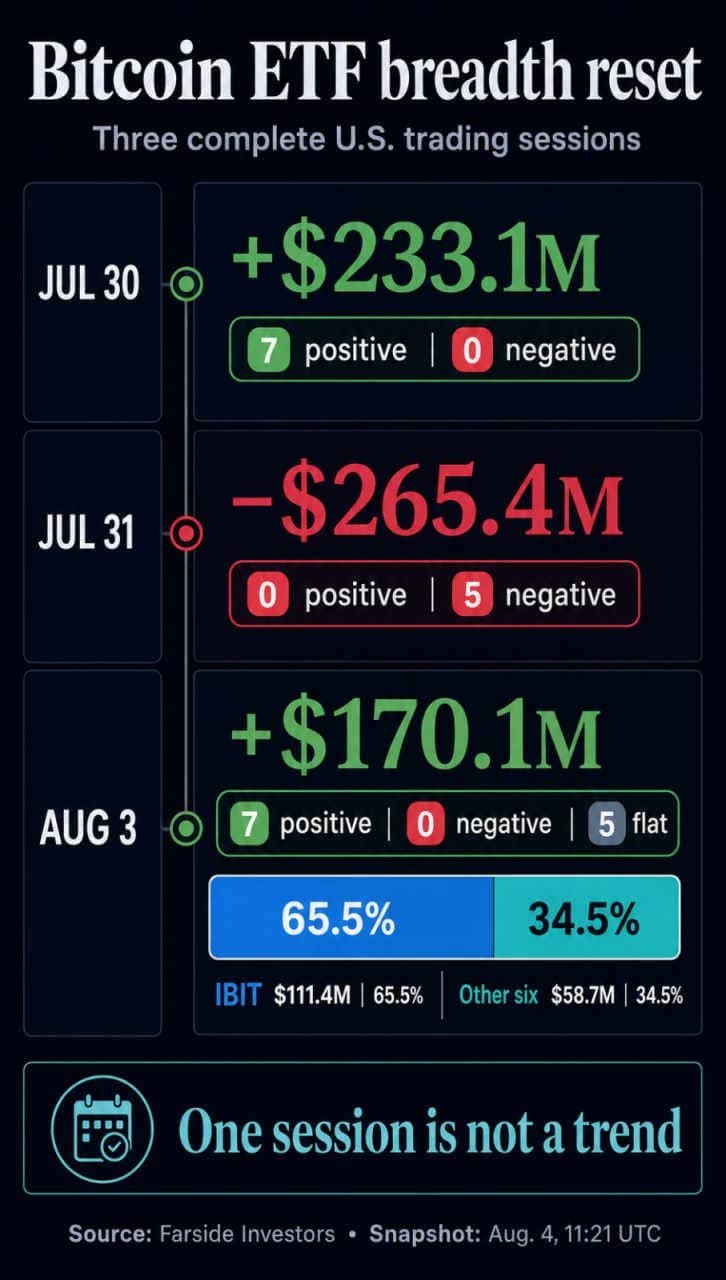
On July 31, U.S. spot Bitcoin ETFs shed a net $265.4 million and not a single fund out of the 12 posted a positive number. On Aug. 3, the entire board flipped: $170.1 million in net inflows, seven funds taking in cash, five flat and zero outflows anywhere.
That’s the headline. The footnote matters more.

One fund is still most of the story
BlackRock’s IBIT pulled in $111.4 million of that $170.1 million. Do the math and it’s about 65.5% of the day’s total from a single issuer.
The other six positive funds combined for $58.7 million. Fidelity’s FBTC took $33.4 million of that, which means the remaining five split roughly $25 million between them.
Per Farside Investors’ daily flow table, EZBC added $9.2 million, BTCO took in $6.7 million and HODL drew $4.5 million. BITB and ARKB brought up the rear at $2.8 million and $2.1 million respectively. BRRR, BTCW, MSBT, GBTC and BTC sat at zero.
Those seven positive entries add up to exactly Farside’s $170.1 million total. No fund column reported a net outflow. Clean tape, lopsided distribution.

What the July 31 selloff actually looked like
The damage two sessions earlier was spread across five funds, and IBIT was not spared. It posted $122.7 million of net outflows on its own.
FBTC lost $54.8 million. GBTC recorded $52.6 million of redemptions, which is its usual role in these tables. BITB lost $17.8 million and ARKB lost $17.5 million.
Nobody was buying that day. Not one of the 12 funds reported a net inflow.
So the swing from July 31 to Aug. 3 is worth roughly $435 million in direction, and the recovery captured about 64% of what walked out the door.

We’ve seen this exact pattern days ago
Here’s the part that should temper anyone reading Aug. 3 as a trend break. The same breadth showed up on July 30, one trading day before the rout.
Seven funds positive. Zero funds negative. And a bigger haul: $233.1 million, or about $63 million more than Aug. 3 managed.
Then the positive-fund count went from seven to zero in a single session, and back to seven on Aug. 3. That’s not a recovery curve. That’s a coin flip with a two-day memory.
The number to watch isn’t the total
If you’re tracking these flows to figure out whether institutional demand is genuinely widening, the daily total is the wrong metric. Breadth counted over consecutive complete sessions is the right one.
Aug. 3 proved cash can reach beyond IBIT. IBIT’s 65.5% share proved the distribution is still top-heavy. Both things are true from the same table.
Repeated positive contributions from multiple funds across a run of sessions would be stronger evidence of broadening than one green row after a red one. July 30 already gave us a green row, and it bought exactly one day of durability.
Context on the underlying asset
Bitcoin is +1.01% over the past 24 hours and currently sits at rank #1 by market cap. Which is to say the spot move doesn’t explain much here either way.
The five funds that printed zeros on Aug. 3 are the quiet tell. BRRR, BTCW, MSBT, GBTC and BTC neither gained nor lost, and GBTC going flat after $52.6 million of redemptions two sessions earlier is a genuine change in behavior for that fund.
Watch whether it stays flat. A GBTC that stops bleeding does more for the aggregate number over a month than any single-day IBIT print.
My advice if you’re using these tables as a signal: stop screenshotting daily totals and start keeping a running count of how many funds print positive, how many sessions in a row. Three consecutive days with five or more funds green would mean something. One day with seven means what July 30 meant, which turned out to be nothing at all.